
Amid ever-increasing uncertainties on the global front and similarly rising geopolitical tensions between India and Pakistan, the Indian equity markets demonstrated strong resilience. They consolidated before ending the week on just a modestly negative note. The trading range remained modest; the Nifty oscillated in a 590-point range. While the markets defended their key support levels, the volatility surged. The volatility barometer, the India Vix, spiked 18.49% to 21.63 on a weekly basis.. The headline index finally closed with a net weekly loss of 338.70 points (-1.39%).
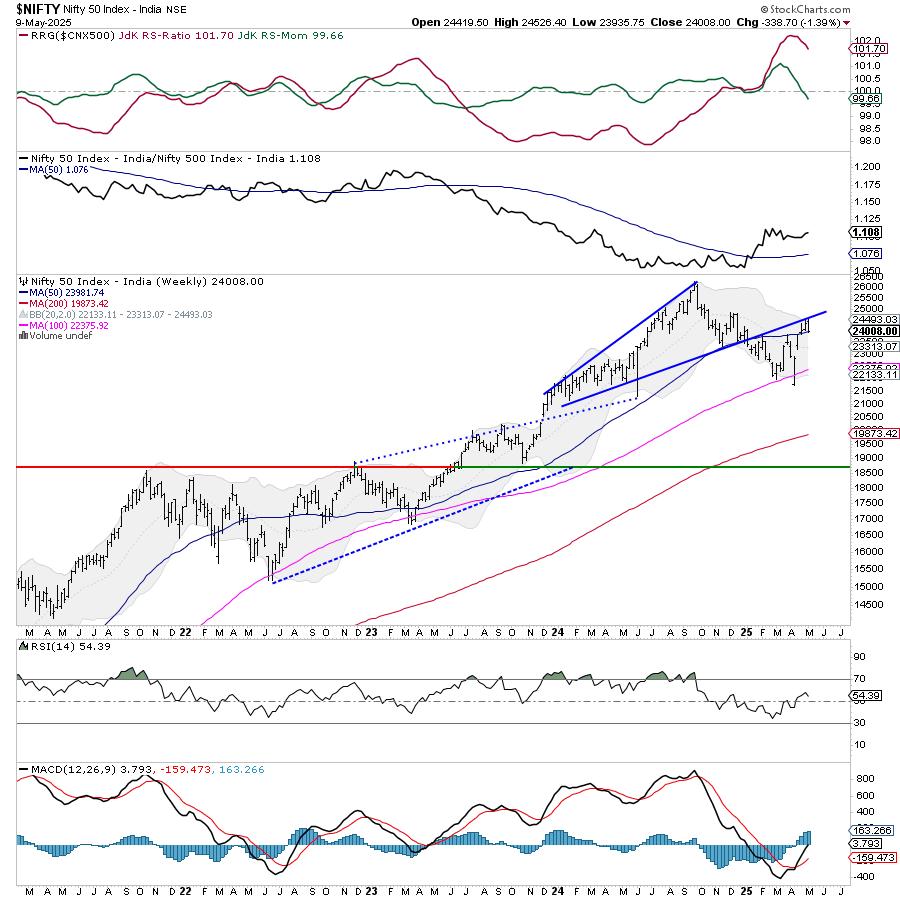
A few important things to note from a technical perspective. The 200-DMA is at 24044; the 50-week MA is at 23983. This makes the zone of 23950-24050 a very important support zone for the Nifty. So long as the Index is able to defend this zone, it will continue consolidating in a defined range. Incremental weakness would creep in only if the 23900 level is violated decisively. On the higher side, as evident from the charts, the markets have continued to resist the rising trendline resistance. From now on, the Nift’s behavior vis-à-vis the zone of 23950-24050 would be crucially important to watch; the Index’s ability to defend or not defend this zone will dictate the trend over the coming weeks.
The levels of 24350 and 24600 are expected to act as probable resistance points in the coming week. The supports are at 23900 and 23630.
The weekly RSI is 54.36; it stays neutral and does not diverge against the price. The weekly MACD is bullish and stays above its signal line. A bearish engulfing candle has emerged. Its emergence near a pattern resistance adds credibility to the resistance placed near 24500-24600.
The pattern analysis of both daily and weekly charts shows that the Nifty has traded quite on the expected lines and within the analyzed range. It has continued resisting the rising trendline resistance near 24500-24600; it has so far defended the key that is created between the 200-DMA and the 50-week MA. The markets would weaken only if they violate the crucial 23900 level; so long as this point stays defended, we can expect the markets to consolidate in a defined range.
Based on the overall technical structure, it is likely that the markets will not see any immediate upward trend. While if the markets end up breaching the 23900 level remains to be seen, it is doubtful that they will initiate any sustainable trending upmove and move past the 24500 levels soon. The hedging activity and the cost of hedging have increased; this is evident from Vix, which has significantly risen over the past few days. While the Nifty has defended the key support levels so far, it remains in a technically challenging environment. It is strongly recommended that the market participants adopt a defensive approach by focusing on the low beta stocks and the stocks with improving relative strength. Staying low on leveraged positions, a continued cautious outlook is advised for the coming week.
Sector Analysis for the coming week
In our look at Relative Rotation Graphs®, we compared various sectors against the CNX500 (NIFTY 500 Index), representing over 95% of the free-float market cap of all the listed stocks.
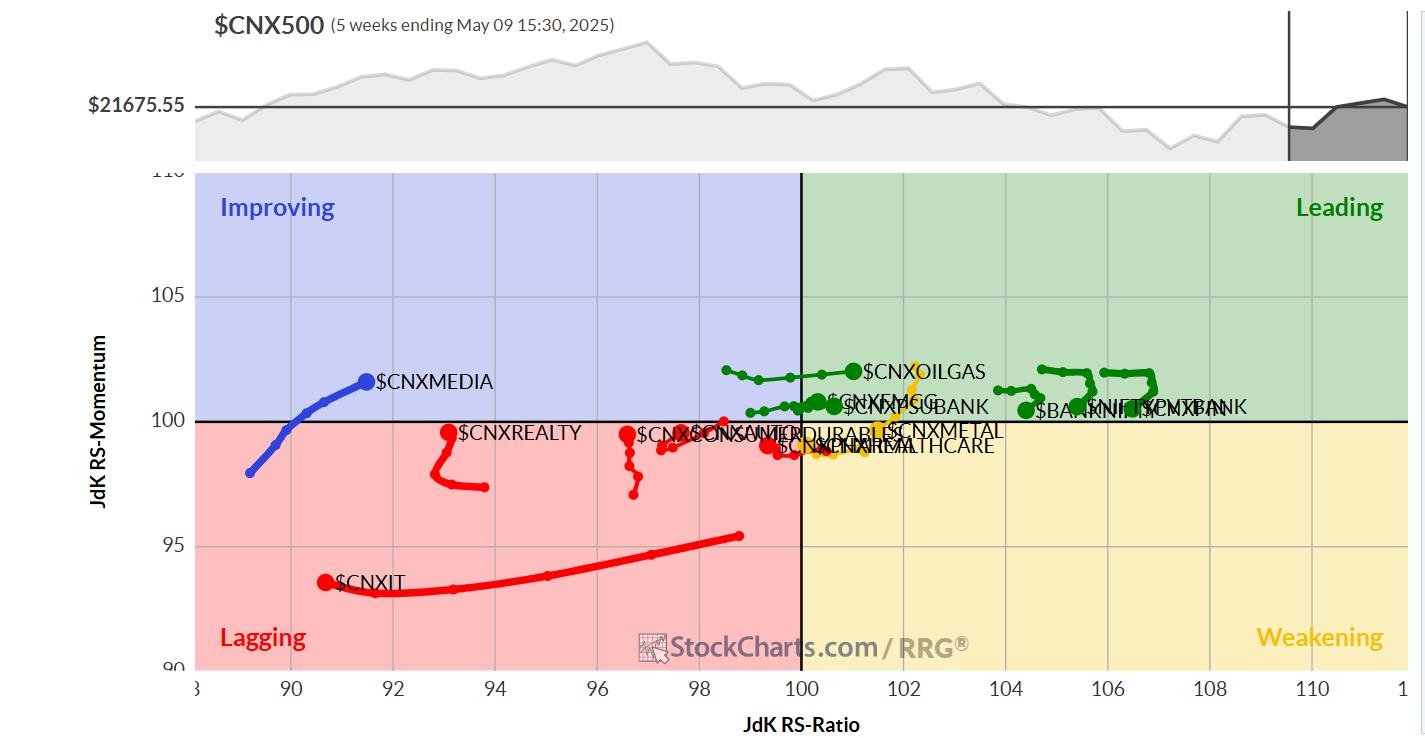
Relative Rotation Graphs (RRG) show that the Nifty PSE Index has rolled inside the leading quadrant. Infrastructure, Nifty Bank, PSU Bank, FMCG, Consumption, Commodities, and the Financial Services Indices are also inside the leading quadrant. These groups are likely to outperform the broader Nifty 500 Index relatively.
The Nifty Metal Index has rolled inside the weakening quadrant. This may cause the sector to slow down and give up on its relative performance. The Services Sector index also remains in this quadrant.
While the Nifty IT Index continues to languish in the lagging quadrant, the Auto and the Realty Indices are sharply improving their relative momentum against the broader markets while staying inside this quadrant.
The Nifty Midcap 100 index has rolled inside the improving quadrant; may see its relative performance bettering over the coming days. The Media and the Energy Indices are also inside this quadrant, and may continue seeing improvement in their relative performance against the broader markets.
Important Note: RRG™ charts show the relative strength and momentum of a group of stocks. In the above Chart, they show relative performance against NIFTY500 Index (Broader Markets) and should not be used directly as buy or sell signals.
Milan Vaishnav, CMT, MSTA
Consulting Technical Analyst
www.EquityResearch.asia | www.ChartWizard.ae